
So, here is my last post before the first evaluation. If you have been following my blog or octave blog, you know that the purpose of this google summer of code project is to create an Interactive Tool for Single Input Single Output (SISO) Linear Control System Design. Also, well-known as sisotool in matlab control system desgin toolbox.
The work done in this period resutled in 5 posts about the work I have done with the help of my mentors Douglas Stewart and John Swensen. The first post is about the community bounding period, and the remaining posts were done every week and described my work update for that specific week. Here is a list of posts in case you desire to go over.
So, according to the timeline proposed in the community bounding period for the first evaluation, the tool should have a basic sisotool interface where the user can add/remove poles/zeros being real or complex. Also, it should have the dragging functionality, where the user can click and reposition the elements to the desired position on root locus diagram.
All the goals were achieved and new functionalities were also added. Therefore, here is a review of what we have so far.
As of now, the sisotool is executed by running GUI_sisotool where it two GUI interfaces will be displayed. The first one is the Interactive Tool and the second one consists of the diagrams, such as: root locus, nyquist and bode diagram.
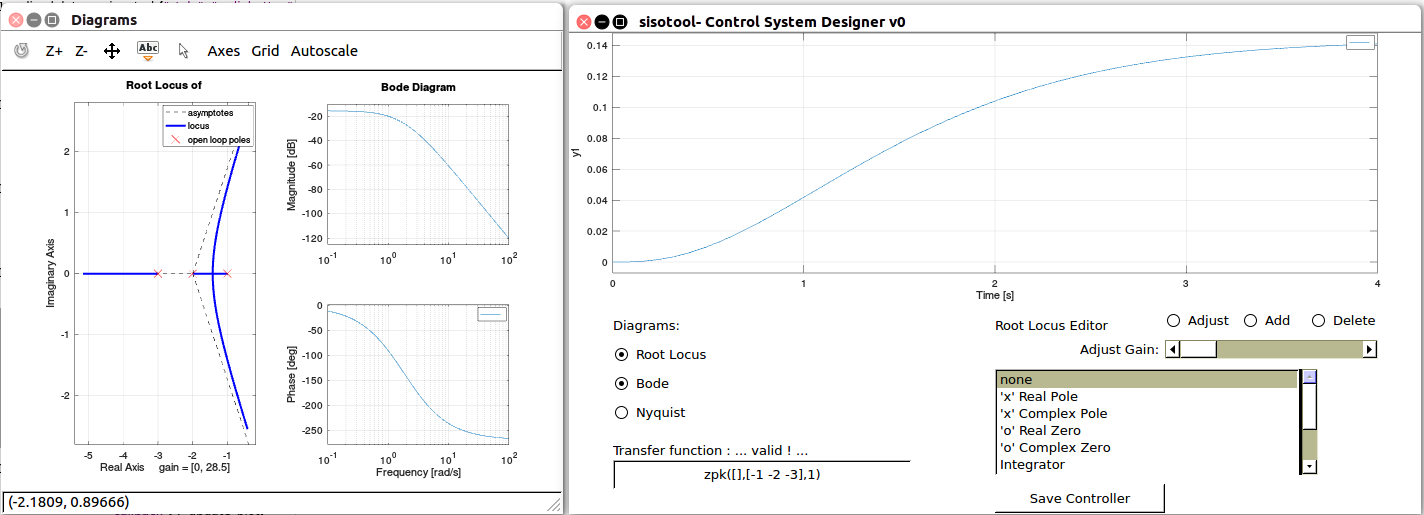
Enter with transfer function: The user can enter with the LTI model on the input field using any m script command, such as tf and zpk. For example:
tf(1, [1 6 11 6])
zpk([], [-1 -2 -3],1)
Both results in the same plant.
Diagrams: As already mentioned, the sisotool can show three different diagrams plus the step response which will be always displayed in the main tool. The interactive diagrams are: root locus, nyquist and bode. Therefore, the user can select the check box with the desired diagrams.
Root Locus Editor: Here the idea is for the user to be able to add the following features:
Currently, only the poles and zeros functionalities are working. Therefore, the users are able to select what feature to add to the controller. By selecting the Add check box, we can click on the root locus diagram and add the feature. In addition, we can adjust the position of the pole/zero using the dragging functionality. For this, we need to select the check box “Add”. We can even delete the feature by checking the Delete box and clicking on the pole/zero.
For now, the gain can be adjusted by the slider element where it will move the eigenvalues on closed loop system. However, during this week I will be working to replace this slider by the dragging the eigenvalues to find the desired gain.
Here is an illustration video of the current tool. This video shows the user using the tool and testing several plants. Then, it shows how to choose the desired diagrams. Finally, adding/grabbing and deleting poles/zeros in order to desing a controller to control the desired plan and save it to workspace is also desmonstrated.
For this post, the video does not contain audio, but for the next video I will record myself explaning the tool as it goes.
Also, I would like to invite you to try it yourself. I would be much happier if you could give me any feedback or comments.
Download current version:
git clone git@github.com:EriveltonGualter/octave-control.git
cd octave-control
make install
Run Octave, add the control package and open sisotool by running:
pkg load control
GUI_sisotool
See you in my next post.