
The first week of coding has been completed.
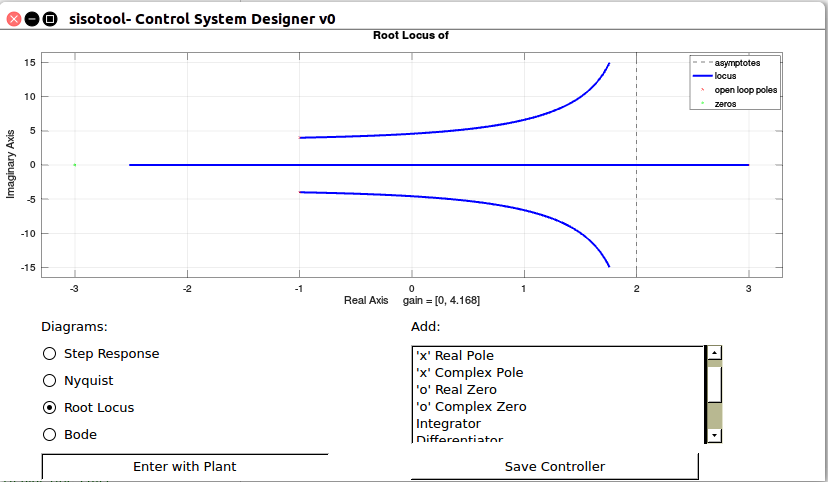
As I mentioned in the last post, the goal of this previous week was to create a fixed layout to study the plot diagrams for the sisotool, as well as to add some UI Element functionality to control the interface. The following image shows the diagram distribution with some elements.
In order to test this concept, the following code can be executed as:
s = tf('s');
sys = 50*(s+3) / (s^ 3-s^ 2+11*s-51);
sisotool(sys);
For the first layout, some ui elements were used without functionality. Figure 2 shows a more robust tool. Here, you can choose the diagram you desire to plot, such as Root Locus, Nyquist, Bode and Step Responce. In addition we have the toolbox to enter the plant and to add elements (Poles, Zeros, PID controller and others) to the system. However, it still not fully working, but it should be completed this week.
Now that my work is flowing more smoothly, I hope that in the next couple of weeks I can develop a basic interactive tool that can be used to design feedback controllers.