
So far, to design a controller using sisotool we need to select the desired feature to add to the compensator, such as real and complex pole or zero. In order to perform this task, we have two options. First, we can go to the main tab and select the feature using the radiobuttons. Lastly, we can use the menu at the top of the page. Both options are presented in the following posts:
However, until now we need to choose the position of the poles/zeros by clicking in the desired position on the axis. Edit Compensator Dynamics appears to mitigate this imprecise process. In addition to adjusting the controller features by adding/dragging the poles/zeros using the interactive method, using the Edit Compensator Dynamics we can edit the dynamic of the controller. This functionality can be view in detail at Edit Compensator Dynamics for Matlab.
So, here we can enter with the gain of the controller and add compensator dynamic.
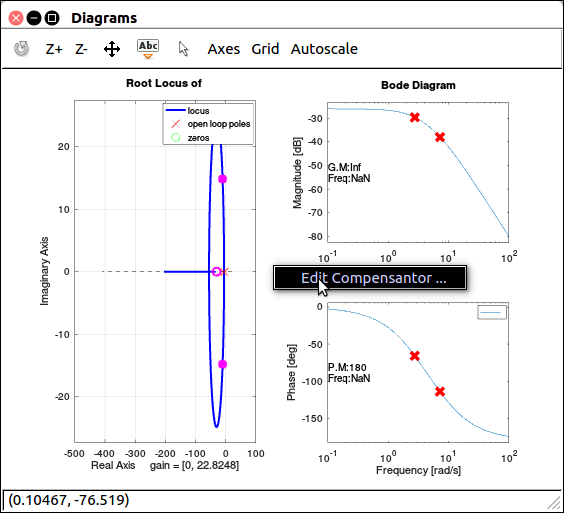
Therefore, this week I have been working on this matter. To open this window, we need to click with the right button on the diagrams and choose “Edit Compensator ...”.
So, here is the “Edit Compensator Dynamics Window”. It has a popupmenu which the user can choose to edit the Compensator. It shows the current compensator in the transfer function format. There are two panels: Dynamics and Edit Select Dynamics. Therefore, the left side shows the dynamic of all features of the controller and after selecting a feature we can edit it in the right panel.
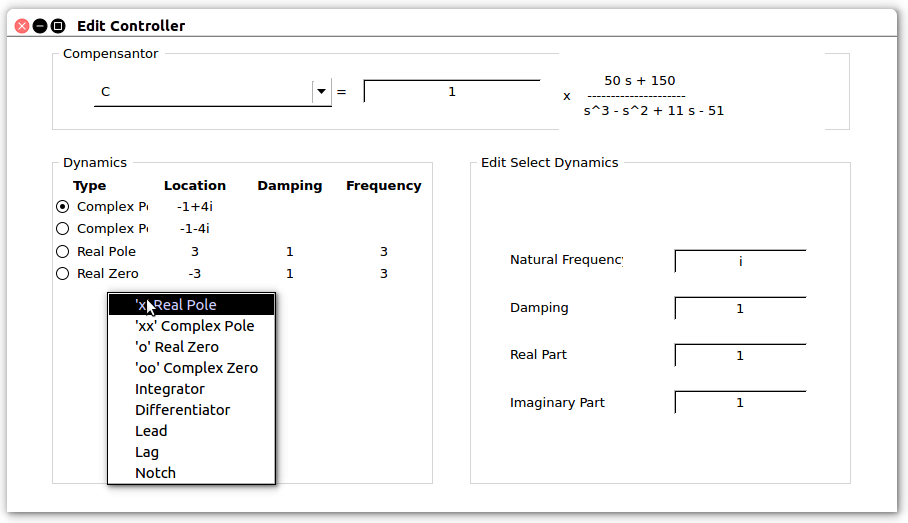
In the Compensator Dynamic from Matlab , it appears on a table. Since, we are still missing the uitable function, I created radio buttons and text to show the poles and zeros. Therefore, these elements are created according to the compensator characteristics. Lastly, we can click with the right button and add new features.
Currently, the Edit Compensator is able to: Display the transfer function; Display all the poles/zeros, type, location, damping and frequency at the Dynamics Panel.
Next week, I will be finishing those functionalities by adding and editing the feature.
Extra comments
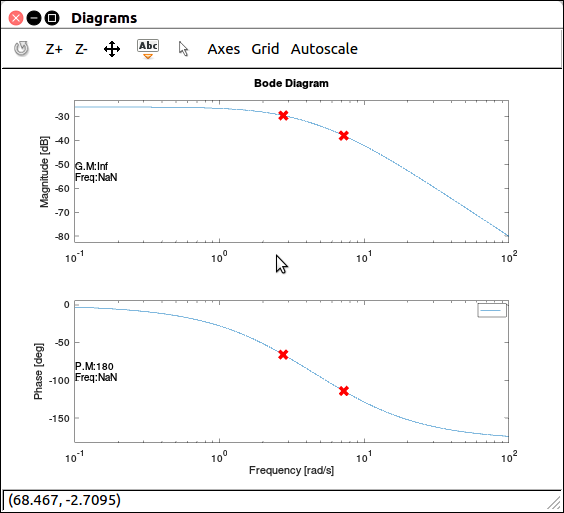
Now, the Bode Diagram shows the location of the poles and zeros, as well as the gain and margin phase as depicted in the following figure:
Lastly, This coming week I am going to fix the building problem some users faced.
See you next post,